


Scope
This page provides computer code to reproduce some of the key
figures / results that were included in our manuscript
"BRAF V600E mutant colorectal cancer subtypes based on gene expression"
(under review at Clinical Cancer Research, April 2016).
.
Summary
Colorectal cancer BRAF V600E mutant patients have a poor prognosis and only some
of the patients respond efficiently to chemotherapy with BRAF-targeted treatments.
Most CRC tumors BRAF V600E tumors also do not respond to recently tested
combinations with MEK and EGFR inhibitors.
There is emerging clinical evidence of heterogeneity within this population,
however the low prevalence of BRAF mutation in colorectal
cancer has prevented its systematic characterization.
In this study, we have collected and investigated gene expression of 218
colorectal cancer patients treated for a tumor with a BRAF mutant tumor;
it is the largest molecularly profiled cohort of this type reported so far.
We took an unsupervised "class discovery" approach: it indicated that
the BRAF mutant tumor population could be divided into
two "natural subtypes" of the disease.
This gene expression variation shows a systematic pattern, it is not "random"
and suggests the existence of a previously unrecognized heterogeneity within the
V600E BRAF mutant CRC tumors.
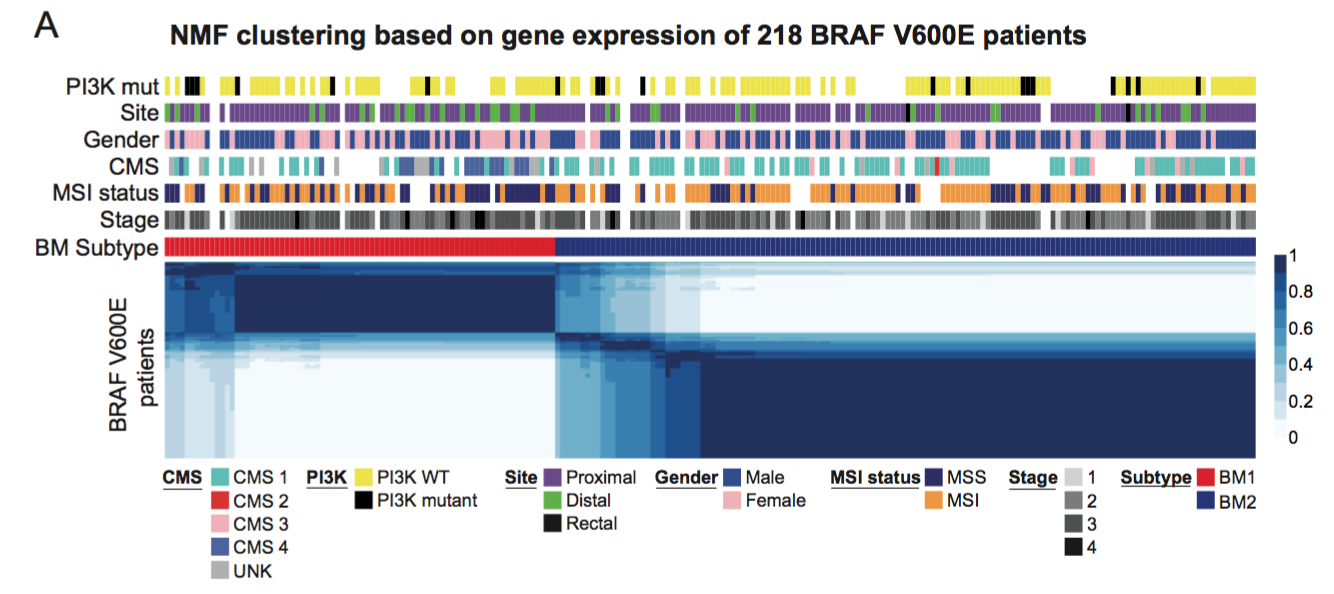 Fig. 1A. Non-negative matrix factorization performed on 218 BRAF mutant patients reveals two natural subtypes. We found that a clustering with a rank of two (k=2) has the best performance among ranks 2 to 6 by using the following classic measure criteria: the cophenetic correlation coefficient (CCC, a measure of the overall stability of sample clustering over multiple solutions with a given rank) and the silhouette width (SW; a measure of the similarity of each sample to the samples in the same cluster relative to the similarity to the other samples).
We call the two subtypes BM1 and BM2 (Figure 1, panel A-B).
These two subgroups are not strongly related to any known clinicopathological factor,
in particular not with the MSI status.
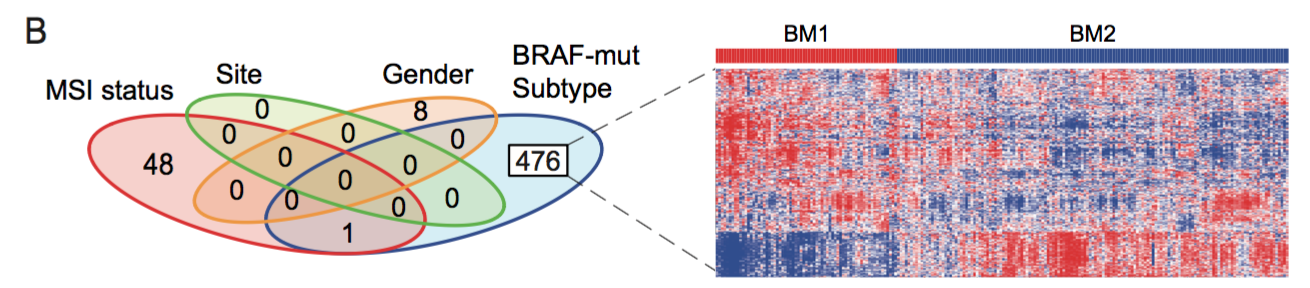 Fig. 1B. To find genes associated with the BRAF mutant subtypes, we fitted a multivariable linear regression using MSI status, tumor location (Site), Gender and the BRAF mutant subtypes as covariables. We found that 476 genes were statistically associated with the BRAF mutant subtypes and not shared with the other clincal variables. The expression of these 476 genes is shown in a heatmap.
The two subtypes BM1 and BM2 display distinct molecular patterns.
BM1 is characterized by high KRAS/mTOR/AKT/4EBP1 pathway activity,
by EMT activation and immune infiltration.
BM2 displays dysregulation cell cycle checkpoint genes (Figure 1, panel C).
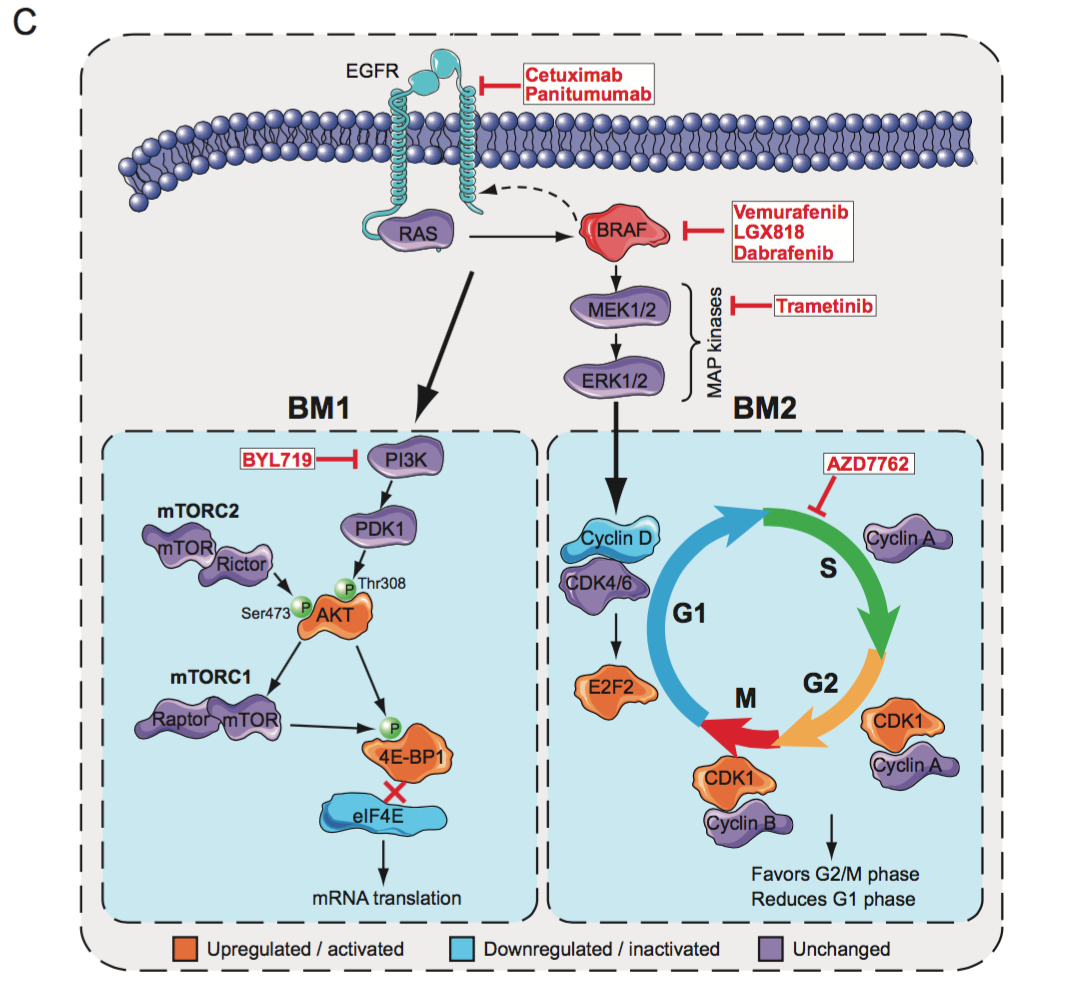 Fig. 1C. Schemes that depict the pathways underlying BRAF mutant subtype biology. BM1 is characterized by high KRAS/mTOR/AKT/4EBP1 signaling while BM2 displays dysregulation of the cell cycle.
These results emphasize that BRAF mutant patients should not be considered as
one homogeneous group of patients and that, potentially,
different therapies should be envisioned to treat patients from these two subtypes.
.
Analysis Script - Reproducible Research
We provide a link to a downloadable ZIP file, which contains a script for the R software system and data that allow the reproduction of some of the key results described in the manuscript.
The zip file contains an R script (BRAF_mutant_subtypes.R), a folder
named Dependencies which contains all data needed to properly execute the
analysis and a ReadMe text file that describes the organization
of the files in the Dependencies folder.
The R file and the Dependencies folder have to remain in the same parent directory
and the path to this directory is used in the R script (at lane 55).
Further specific comments are embedded within the script.
.
.
.